The survey was sent to 8 people in the my class. With the data collected, I design variations of design for each question, resulting in unique data portraits for my classmates.
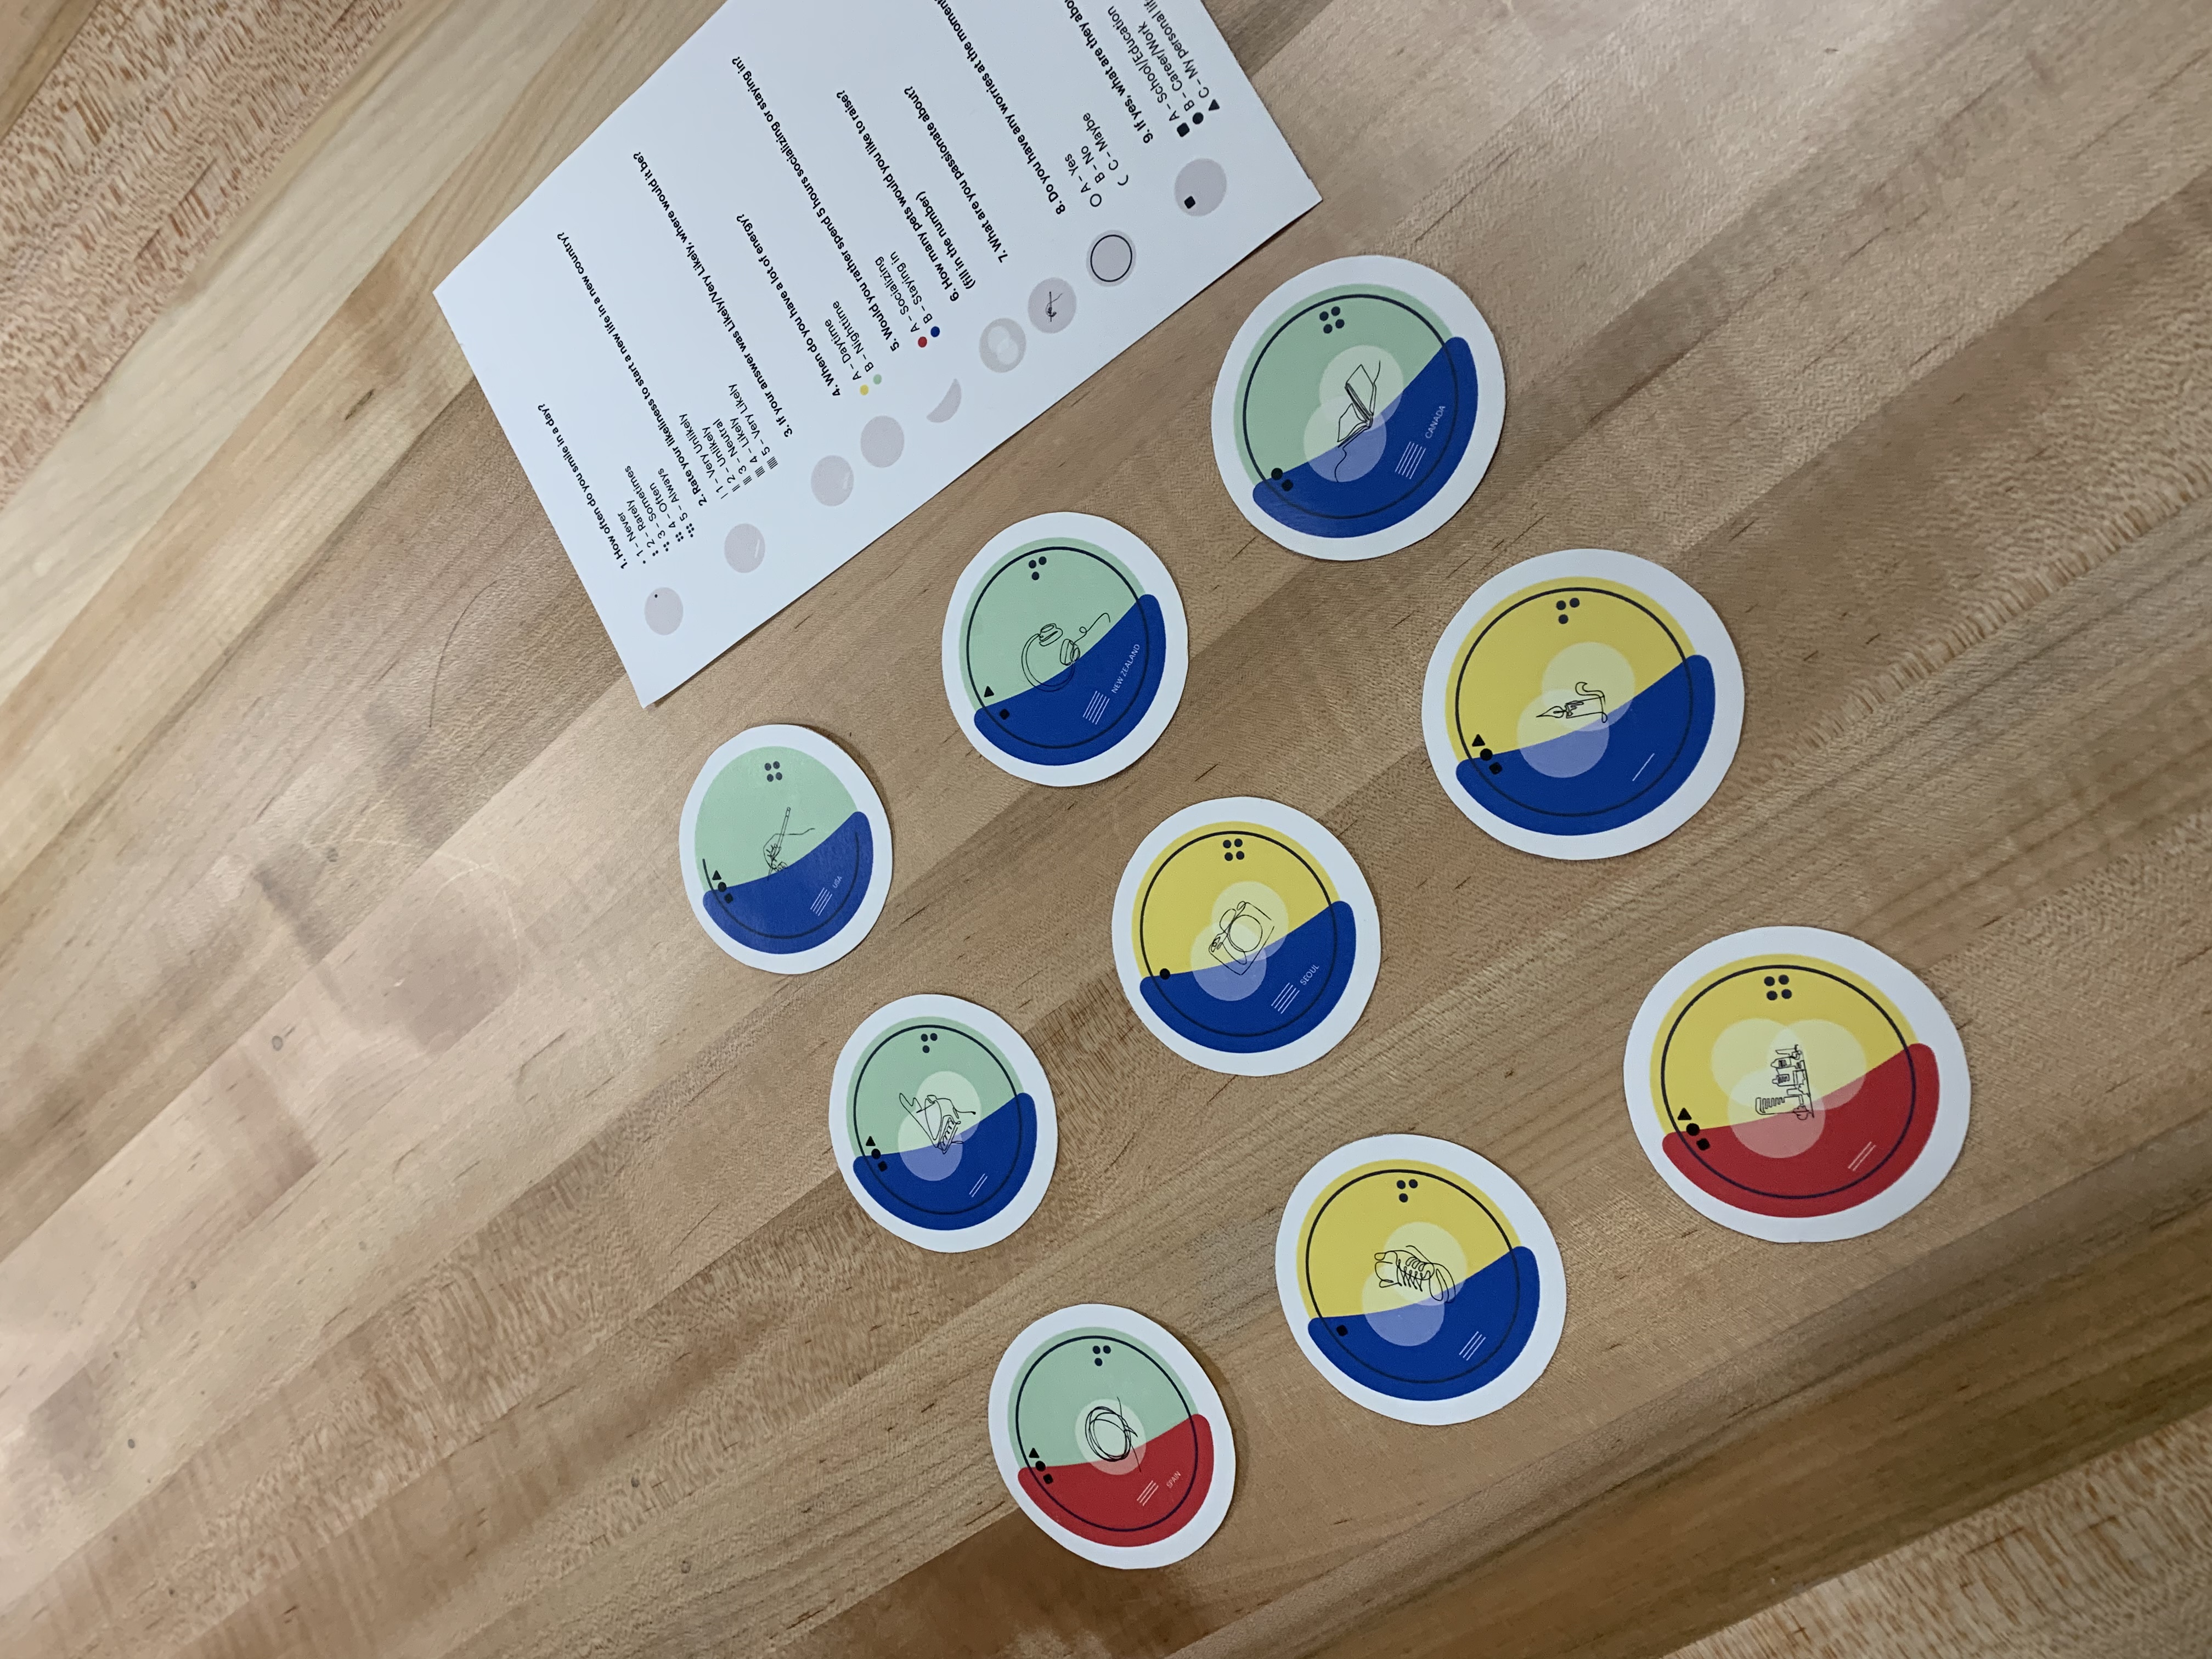
Data portrait was my first exposure to data visualization. Inspired by Giorgia Lupi's work at TED, I approached this assignment exploring the question "What image do you want to portray to people?" for the first project in Information Design Studio 1. From that, I brainstormed survey questions for my classmate and generated personal data for the portraits.
"The color, position, and rotation of every element indicated a different response, creating a work of art from the data that makes you, you." - Giorgia Lupi
The survey was sent to 8 people in the my class. With the data collected, I design variations of design for each question, resulting in unique data portraits for my classmates.

The survey was sent to 8 people in the my class. With the data collected, I design variations of design for each question, resulting in unique data portraits for my classmates.
For the data map project, I built on the biographical data portrait to create a data portrait of about restaurant locations in Boston, Massachusetts. I've always curious about why the restaurants were at the location they are today, and what factors are considered when opening up a restaurant at a certain location.
With the idea, I identified seven metrics to discover their correlation to restaurant location and compare metrics across 21 neighborhoods.
Data source:
1. Active Food Establishment License – Analyze Boston
2. 2020 Cencus - BPDA Research & GIS

For this project, I use the information of Vienna's subway map to visualize:
The purpose of this project is to apply information-seeking mantra such as Overview, Zoom, Filters, Details-on-demand and Relate to communicate information to viewers.


From creating data visualization on Illustrator and Figma, I had the chance to apply HTML, CSS and Javascript library D3.js to create varieties of visualizations, including bar charts, scatter plots, and line charts.
After the projects, I was able to develop proficiency in problem-solving through code and learning how to interact with code as a medium for design. Currently, I'm self-learning Javascript and React to combining web development languages in user experience design.
